I sort of wound up with a formidable little fleet of sites.. tronswan, chomptron, swantron, mt, wrenchtron, jswan.dev. The DevX dawg in me naturally wanted to know if they were up.
So I wrote the dead simplest thing that could show me. uptime-monitor is 234 lines in one file.. a GitHub Actions cron that pings every site every 5 minutes and writes uptime % and incidents to a public gist. No VM, no terraform, no control plane. It runs at $0 and only tips over when GitHub tips over. For “is it up, over time, and when did it break,” it’s honestly hard to beat. It’s still my heartbeat, and I’d build it the same way again.
But it answers one question, and there’s another it can’t touch: did this deploy actually work?
Every site deploys from CI, and every deploy hands me a green checkmark when it’s done. The checkmark means the pipeline exited 0.. not that the site is up, serving the code I just shipped, to a real request. A HEAD / coming back 200 can be a CDN handing you a cached page while the origin behind it is face-down. And the uptime monitor won’t save me here: a cached 200 looks “up” to a pinger too, and a five-minute cron isn’t tied to the deploy that just went out.
The usual answer to that is a post-deploy smoke test.. curl the homepage in CI, check for a 200, move on. That’s a deploy gate, and it beats nothing. I do lean on a lot of post-deployment Playwright jobs, but that’s classic overhead. Still.. a 200 is a low bar, and I wanted to improve on it: a gate that proves the new build is serving real requests before the deploy is allowed to call itself done. Same instinct as the uptime heartbeat.. small, cheap, $0.. pointed at a different question.
The Idea
We’re going OTel. OpenTelemetry, but pointed backwards. Instead of instrumenting for dashboards you read after something already broke, use it as a gate. Right after a deploy: fire synthetic traffic at the live URL, tag every request with a W3C trace id, and check that the telemetry for that exact run actually lands. If it lands, the request flowed all the way through to the real application.. not an edge cache, not a stale instance. If it doesn’t land within the latency and availability you expect.. fail the deploy.
A CI step can lie about an exit code. It can’t fake a span showing up in a buffer.
What I Built
watchtron is the paved road for that. A few moving parts:
- A prober (undici) that drives golden-signal traffic at a service’s critical routes, propagates trace context, and exports its client spans as OTLP/HTTP JSON.
- A tiny control plane on a free-tier GCE e2-micro.. receives the spans, runs
/verify, serves a dashboard and status badges, Caddy out front for auto-HTTPS. The whole thing runs at $0. - A reusable GitHub Actions workflow any repo calls right after its deploy job. The deploy is gated on the verdict.
The fleet is deliberately heterogeneous.. DigitalOcean App Platform, Cloud Run, GitHub Pages, Firebase Hosting, a self-hosted AT Protocol PDS.. and watchtron verifies all of them from one workflow. Black-box probing covers the static sites and the unmodifiable upstream; white-box server spans enrich the two Express services we own the runtime for.
Onboarding a service is basically this:
verify:
  needs: deploy
  uses: swantron/watchtron/.github/workflows/verify.yml@main
  with:
    service: tronswan
    version: ${{ github.sha }}
  secrets:
    otlp_endpoint: ${{ secrets.WATCHTRON_OTLP_ENDPOINT }}
    token: ${{ secrets.WATCHTRON_TOKEN }}
For tronswan and chomptron there’s a drop-in @swantron/otel-bootstrap so the origin emits its own server span. That’s the good part.. it lets the control plane confirm the synthetic request actually reached the instrumented app and stitch the two halves of the trace together.
What It Verifies
For each run, the control plane gates the deploy on:
- availability and p95 latency over the synthetic burst
- every critical route actually got probed
- (white-box) a server span correlated with the prober’s trace.. the request truly reached the origin, not a cache
- (white-box, optional) version assertion.. when you pass the deploy’s git SHA and the origin reports one back, verify checks they match. Green now means this build is serving, not just something. Skipped cleanly for services that aren’t wired to report a version yet.
It also surfaces diagnostics that don’t block by default:
- a latency regression flag against a rolling baseline.. catches slow creep that’s still technically under the absolute limit
- an error breakdown (4xx vs 5xx vs transport) so a red availability number is actionable instead of opaque
Anything in the gate list fails, the deploy fails. The control plane is the authority, not the CI log.
The Honest Comparison
Once watchtron grew up a bit.. a dashboard, persistence on the little VM, regression baselines.. I had to be honest with myself about something. A chunk of what I was bolting on was quietly wandering into the exact territory the 234-line gist-pinger already owned: continuous health over time. And on that front it was losing. The pinger is cheaper, simpler, runs 6× more often, and actually keeps history. Keep going down that road and I’d just be rebuilding the uptime monitor, worse.
So I drew a line and stopped making them compete. They’re not the same job. uptime-monitor is the heartbeat.. is it up, over time, when did it break? watchtron is the deploy gate.. did this deploy ship working, instrumented code, and should we let it through? A cron pinger can’t fail a deploy or prove the new version is serving. Two small $0 tools, two different questions. Both viable.
Once I drew that line, the nice part showed up.
The Combined View
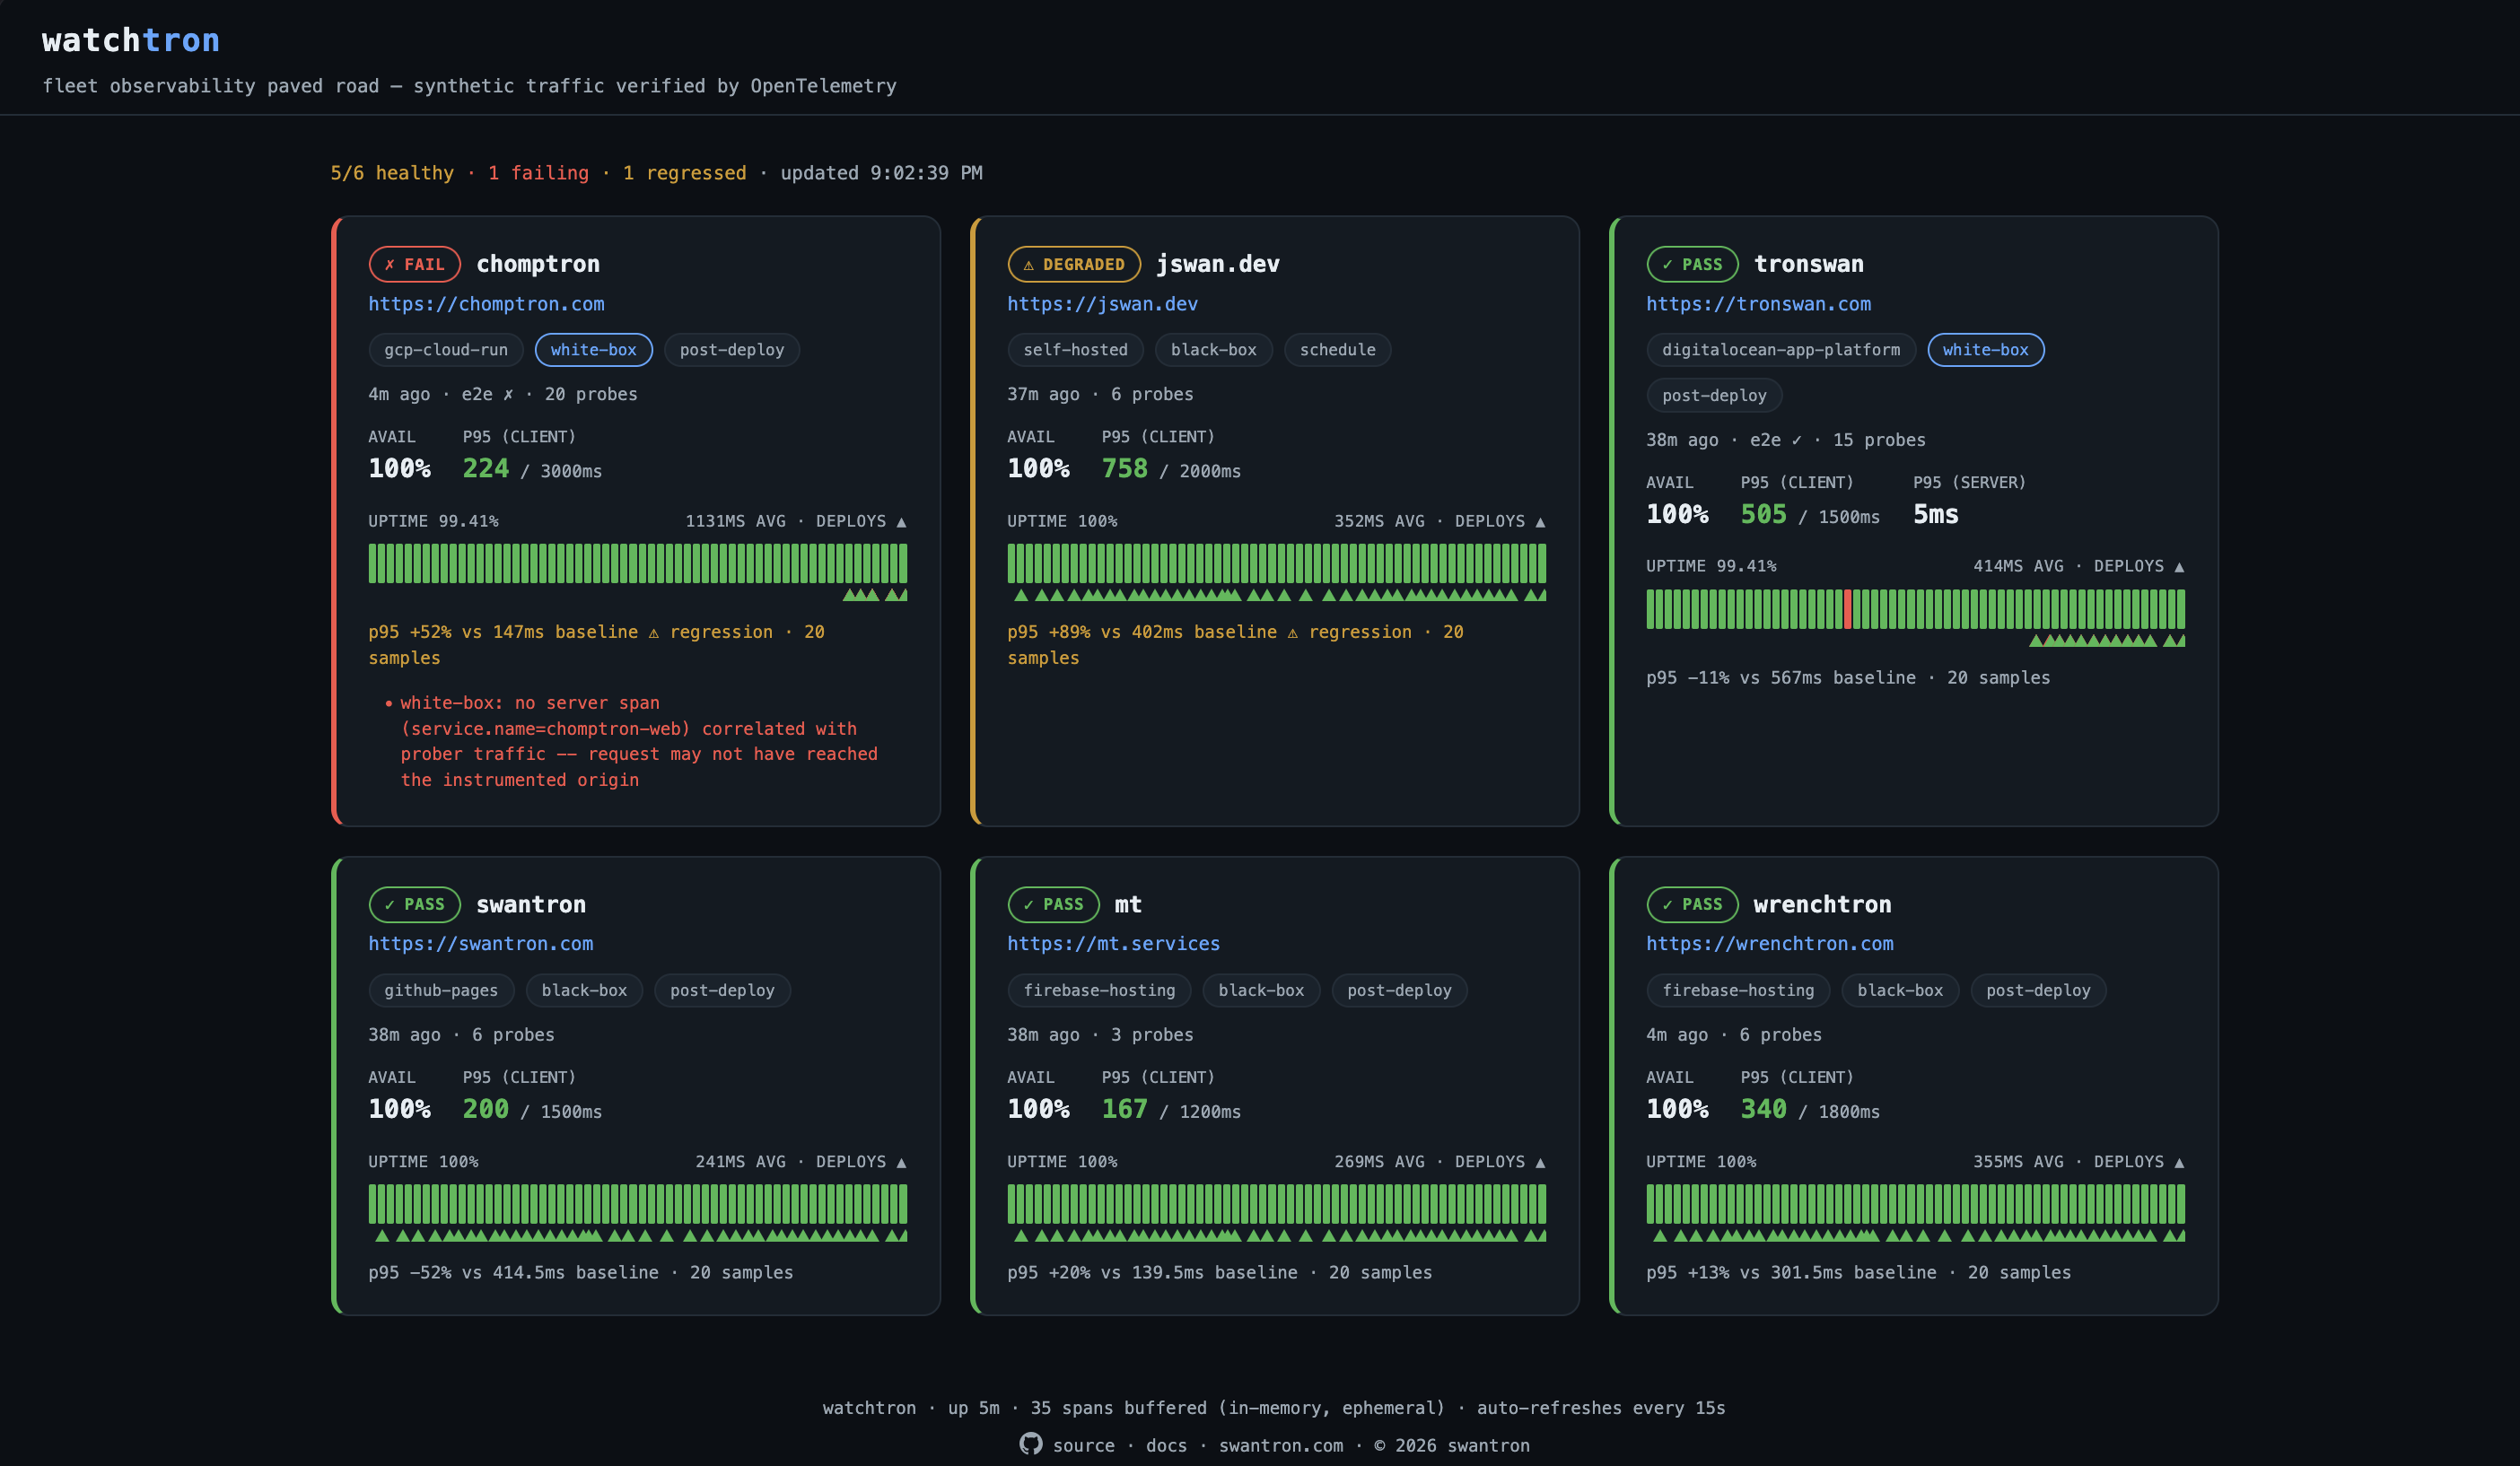
Both tools watch the same fleet, so I stopped duplicating and started overlaying. Take the uptime monitor’s continuous up/down timeline, and drop watchtron’s verified-deploy markers right on it. One strip per service: green up, red down, and little triangles where deploys landed.. green if the deploy proved itself end-to-end, red if it didn’t.
Now I can actually see whether a deploy lines up with a dip. The reliability timeline and the deploy provenance, on the same axis. Neither tool gives you that on its own.
It lives on watchtron’s dashboard at watch.swantron.com, and in a cleaner public cut on tronswan.com/status.
The caveats, because there are always caveats
- It’s a gate, not an SLO. The score comes off a small synthetic burst fired right after deploy. It tells you “the new build answered fast and correctly just now,” not “we hit four nines this quarter.” Calling it an SLO would be lying, so I don’t.
- The control plane is a single point of failure for the whole pipeline. If the e2-micro is down, every deploy wants to block on it. So it fails open.. an unreachable control plane is a watchtron outage, not a service failure, and it won’t hold your deploy hostage unless you opt into strict mode.
- Green still only means “passed a synthetic check.” It won’t catch a bug that only shows up under real user behavior. Strong signal, not Playwright.
- Regression detection is informational by default.. it flags slow creep on the dashboard but doesn’t fail the deploy unless you opt a service into gating on it.
- And the one that got me: GitHub disables scheduled workflows after ~60 days of repo inactivity. The uptime monitor has a dirty keepalive for exactly this. watchtron’s cron.. did not. The new dashboard’s staleness flag is what surfaced it.
Try It
Source: github.com/swantron/watchtron
The heartbeat half: github.com/swantron/uptime-monitor
Live: watch.swantron.com · tronswan.com/status
It runs at $0 on free tiers, onboarding a service is a few lines of yaml, and a green checkmark means a bit more. Check it out ^